
Comparing energy setups on one honest metric
A simulation-driven calculator that compares various mobile-energy configurations on a single metric — euro per kWh delivered.
Various fundamentally different energy setups, and no fair way to compare their true cost and emissions — static spreadsheets couldn’t capture real operations.
A simulation engine that models energy dispatch in 15-minute steps, wrapped in an interactive dashboard, normalising every option to euro per kWh delivered.
Configurations once compared on intuition can now be compared quantitatively — and the tool is reusable across projects, sites, and scenarios.
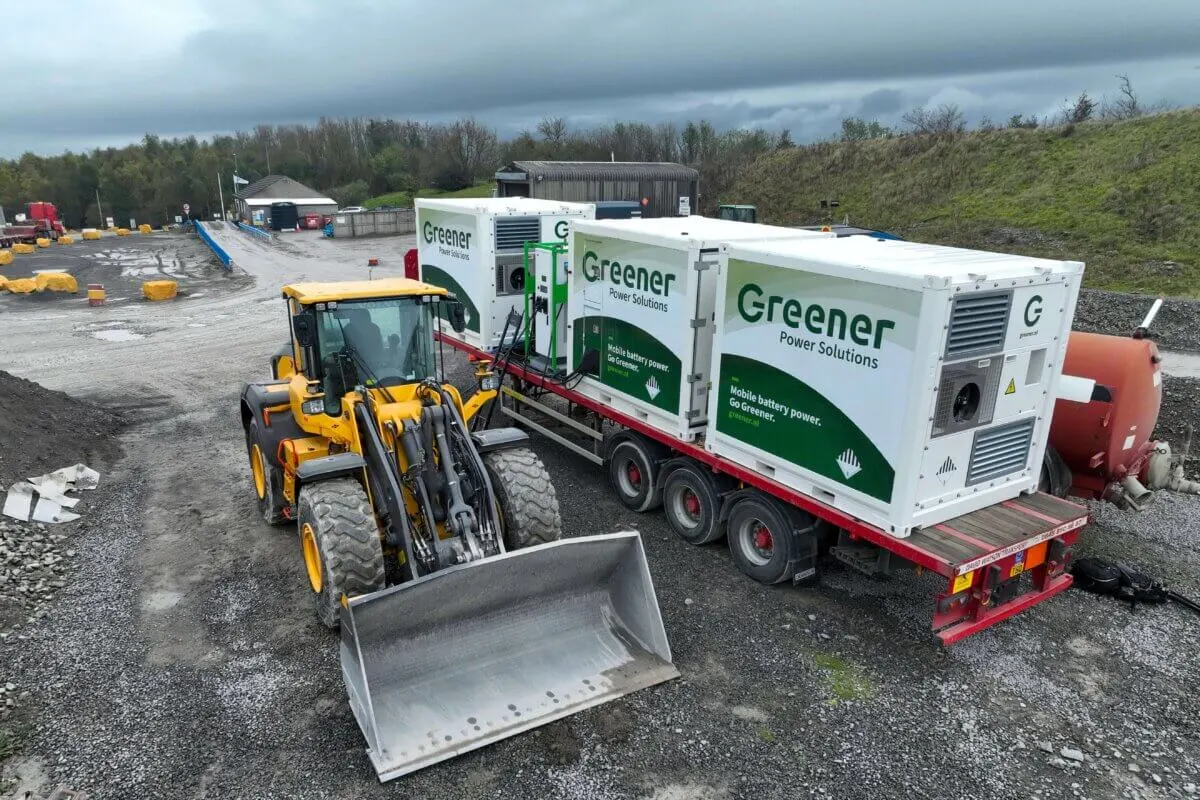
Greener Power Solutions provides mobile battery energy storage systems for construction sites, festivals, EV charging and grid stabilisation — using various technologies and renewable energy fuels like HVO, hydrogen and biogas, and by swapping batteries. For any given project, they needed to know which setup was genuinely the most cost-effective and lowest-emission option, on a basis they could stand behind.
What the tool does
15-minute simulation
Models energy dispatch across the whole project — generator runtime, battery charge, fuel use, and fleet logistics — instead of static estimates.
One fair metric
Normalises every cost — equipment, fuel, maintenance, logistics, mobilisation — to euro per kWh delivered, so different setups compare honestly.
Interactive dashboard
Adjust duration, distances, battery types, and grid connection, and compare configurations side by side with visual dispatch traces.
Multi-site fleet logic
For battery-as-a-service, it simulates truck fleets servicing several sites, with proactive routing and battery reservation.
“The project has provided a clear and efficient way to determine the most cost-effective (€ / kWh) and lowest-emission energy solution at each project site”
Greener operates across fundamentally different energy technologies, each with its own cost structure and operating logic. Their existing Excel models could estimate, but they couldn’t capture how energy is actually dispatched over the course of a project — so the choice between setups came down to experience and intuition. Greener wanted something they could ultimately put in front of a customer and defend, but also use to support internal investment decisions.
How we worked
We built the tool in close collaboration with Greener, working from their real projects and assumptions rather than a generic model.
-
Their projects, not a generic model
Every assumption came out of work Greener had actually run, so the numbers were arguable against reality from day one.
-
A simulation core, a simple surface
The heavy lifting happens under the hood; the interface is closer to a webshop than an engineering tool, so it stays usable for people who aren’t modellers.
Theirs to own
We delivered it as something Greener owns outright — the opposite of the black box the tool exists to replace.
-
Runs on their own machine
No dependency on us, and no internet connection needed to use it.
-
Every assumption visible and adjustable
Nothing is buried in the model, so a result can always be traced back to what produced it.
-
Full export to Excel
Results go straight into the reporting their stakeholders already read.
-
Trained, then documented
We ran a session with their team and left the documentation behind, so they can keep using and extending it after we step back.
What it changed
Greener can point the tool at any project and get a quantitative, transparent comparison — every assumption in view, and nothing hidden in a black box.
Key outcomes
-
Quantitative comparison of configurations that were previously judged on intuition
-
Surfaced where new potential lies and where the bottlenecks are
-
Every parameter is adjustable, so the tool is reusable across projects, sites, and scenarios
-
Runs locally without an internet connection, and is ready for future cloud deployment
Built with
Ready to unlock value from your data?
Let’s connect for a no-obligation conversation about your goals and how we might support them.